A production analytics dashboard from raw machine data
A mid-size manufacturer had years of machine data but no way to use it. We built a pipeline and dashboard that turns floor data into decisions leadership can act on daily.
The challenge
- Machine data was trapped in proprietary systems and exported as files nobody had time to analyze.
- Downtime was only understood after the fact, so the same failures kept recurring.
- Leadership made capacity decisions on intuition because there was no reliable, current view of the floor.
Our approach
Built a reliable data pipeline
We ingested machine output into a time-series store with validation, so the data is clean, current, and queryable.
Modeled the metrics that matter
Working with floor managers, we defined throughput, utilization, and downtime metrics that map to how the plant actually runs.
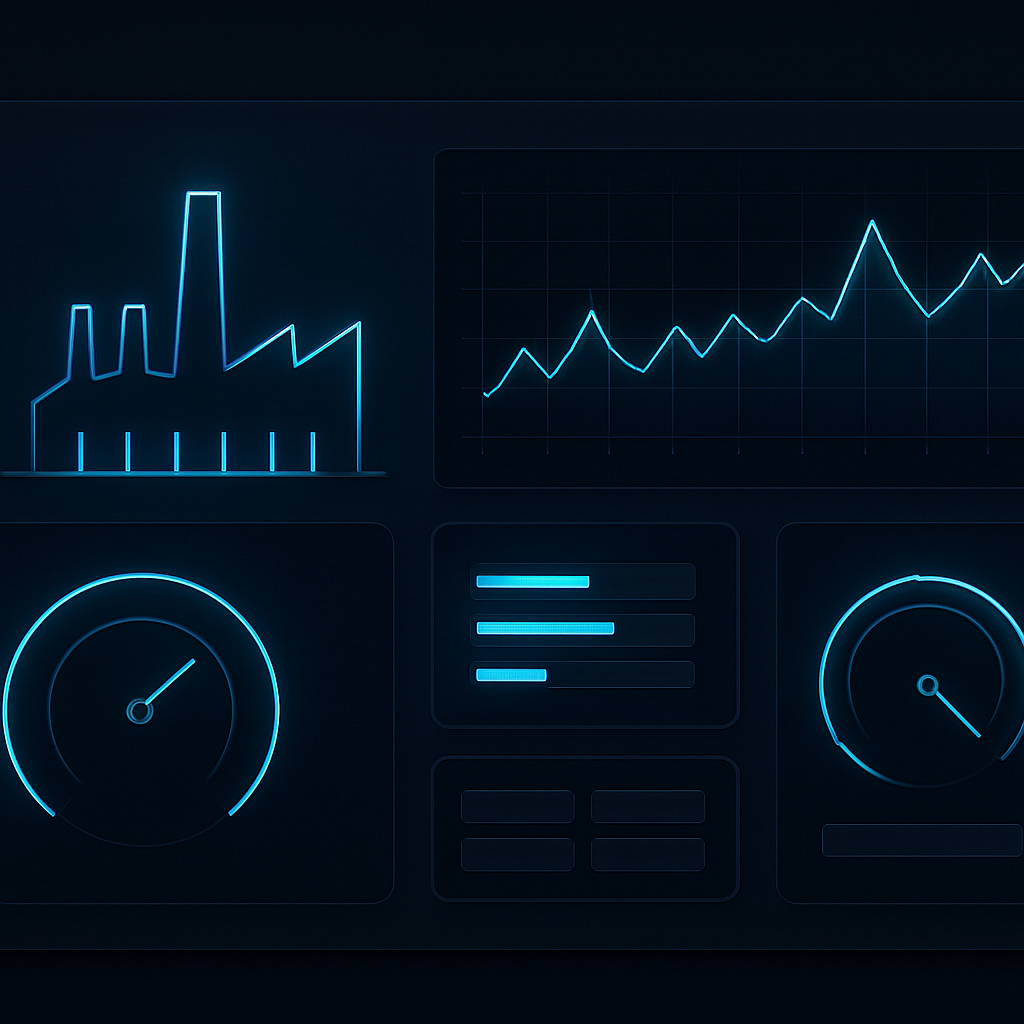
Delivered a live floor dashboard
A real-time dashboard surfaces line performance, bottlenecks, and downtime causes, with alerts when a line falls below target.
Enabled root-cause analysis
Historical views let the team trace recurring downtime to its source and prioritize the fixes with the biggest payoff.
The results
- Throughput rose 17% after bottlenecks became visible and addressable.
- Unplanned downtime fell 31% once recurring failure causes were identified and fixed.
- Leadership now plans capacity from live data instead of guesswork.
We were sitting on a goldmine of data we could not use. Now the whole leadership team starts the day looking at the same numbers.
Have a project like this?
We would love to hear what you are working on. Let us help you scope a clear, reliable path to delivery.